Comprehensive Guide Real Time Public Data Systems Implementation

Table of Contents
- Definition and Scope of Real-Time Public Data Systems
- Core Components of Real-Time Public Data Infrastructure
- Centralized vs. Decentralized Models for Real-Time Public Data
- Integration of Real-Time Public Data in Operational Workflows
- Technologies Enabling Real-Time Public Data Dissemination
- Hardware Infrastructure for Sub-Second Data Processing
- Software Stack for Real-Time Data Streaming
- Blockchain and Distributed Ledgers for Transparency
- Data Path Flowchart: Source to End-User with Latency Benchmarks
- Use Cases and Applications in Public Sector Operations
- Disaster Response Coordination with Real-Time Public Data
- Designing a Real-Time Public Dashboard for Urban Mobility
- Challenges and Ethical Considerations in Real-Time Public Data Systems
- Technical Challenges in Data Accuracy, Consistency, and Privacy
- Ethical Implications and Mitigation Strategies
- Governance Framework for Transparency and Security
- Regulatory Frameworks and Compliance Requirements
- Implementation Roadmap for Agencies Adopting Real-Time Public Data
- Phased Approach to Real-Time Public Data Deployment
- Templates for Data-Sharing Agreements
- Prioritizing Real-Time Data Projects Using a Weighted Scoring System
Real-time public data systems represent a transformative force in modern governance, enabling instantaneous decision-making across critical sectors from transportation to emergency response. By integrating dynamic datasets—ranging from IoT sensor feeds to API-driven government repositories—these infrastructures bridge the gap between raw information and actionable intelligence. The evolution from legacy broadcast systems to cloud-native, sub-second streaming platforms has redefined public sector efficiency, yet its full potential hinges on balancing technological sophistication with ethical safeguards. This guide explores the architectural pillars, operational use cases, and regulatory frameworks shaping real-time public data, while addressing challenges in scalability, bias mitigation, and cross-sector collaboration.
The adoption of these systems is no longer optional but a strategic imperative for agencies seeking to enhance service delivery, reduce operational costs, and foster civic engagement. From live flood mapping during disasters to algorithmic fraud detection in welfare programs, the applications demonstrate how real-time data can save lives, optimize resource allocation, and empower citizens with transparent, up-to-date information. However, the transition requires navigating complex trade-offs: ensuring data accuracy amid sensor failures, mitigating algorithmic bias in high-stakes decisions, and securing sensitive infrastructure without stifling public access. This discussion provides a structured roadmap for policymakers, technologists, and developers to deploy, govern, and innovate with real-time public data responsibly.
Definition and Scope of Real-Time Public Data Systems
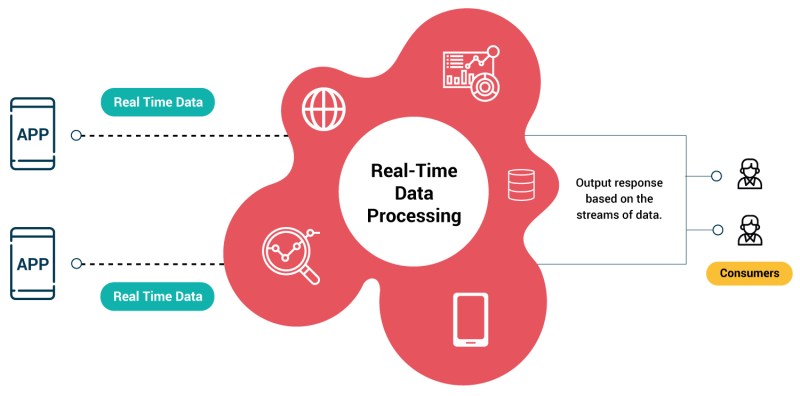
Real-time public data systems represent a critical infrastructure for modern governance, enabling instantaneous access to actionable information across sectors. These systems integrate diverse data sources—ranging from sensor networks to administrative databases—into cohesive pipelines that process, analyze, and disseminate data with minimal latency. Their scope extends beyond traditional government operations, influencing private-sector decision-making, civic engagement, and emergency response coordination. The core components of such infrastructures include data acquisition layers (e.g., IoT devices, APIs, and manual submissions), processing engines (streaming analytics, edge computing, and cloud-based workflows), and dissemination channels (public APIs, dashboards, and push notifications). The design of these systems often reflects trade-offs between centralization (for standardized control) and decentralization (for resilience and scalability), each offering distinct advantages depending on the use case.Core Components of Real-Time Public Data Infrastructure
The architecture of real-time public data systems is built on three interdependent layers:1. Data Sources
Real-time data originates from heterogeneous inputs, including:
Processing Pipelines
Data is transformed through stages optimized for velocity and accuracy:
Dissemination Channels
Delivered via:
Centralized vs. Decentralized Models for Real-Time Public Data
The choice between centralized and decentralized architectures influences latency, scalability, and governance. Below is a comparative analysis:| Model Type | Data Latency | Scalability | Use Cases |
|---|---|---|---|
| Centralized | Moderate to high (single point of failure; batch processing may introduce delays). Example: U.S. Department of Transportation’s National Transit Database aggregates monthly reports from transit agencies, with a ~30-day lag for validation. |
Limited by single-node bottlenecks; horizontal scaling requires complex coordination. Challenge: Adding new data sources may overwhelm legacy systems (e.g., UK’s National Health Service faced delays integrating real-time A&E wait times due to monolithic databases). |
|
| Decentralized | Low (edge computing reduces network hops; peer-to-peer validation minimizes delays). Example: Hyperledger Fabric enables sub-second consensus for supply chain data (e.g., IBM’s TradeLens platform tracks shipping containers in real time). |
High (modular nodes scale independently; blockchain or federated databases distribute load). Advantage: City of Amsterdam’s decentralized air quality network uses low-cost sensors with local processing, reducing cloud dependency. |
|
| Hybrid | Balanced (centralized governance with decentralized edge processing). Example: Singapore’s Smart Nation initiative uses a central Data.gov.sg portal but deploys edge analytics for traffic management. |
Moderate (scalable for specific workloads; e.g., AWS IoT Greengrass extends cloud logic to devices). |
|
Integration of Real-Time Public Data in Operational Workflows
Government agencies and private entities leverage real-time data to enhance efficiency, transparency, and responsiveness. Sector-specific applications demonstrate distinct implementation strategies:Transportation Systems
Healthcare
Emergency Services
Technologies Enabling Real-Time Public Data Dissemination
Real-time public data systems rely on a convergence of hardware, software, and network architectures to deliver sub-second updates to end-users. The efficiency of these systems hinges on low-latency data ingestion, processing, and dissemination, often spanning distributed environments with stringent compliance requirements. This section examines the foundational technologies—both open-source and proprietary—that underpin real-time public data infrastructure, including their trade-offs in cost, customization, and regulatory alignment. Additionally, it explores the role of blockchain and distributed ledgers in enhancing transparency and auditability for public datasets.Hardware Infrastructure for Sub-Second Data Processing
The physical layer of real-time public data systems must support high-throughput, low-latency operations while maintaining scalability. Key hardware components include:- Edge Computing Nodes
Deployed closer to data sources (e.g., traffic sensors, weather stations), these devices reduce latency by processing data locally before forwarding critical updates. Examples include AWS Outposts, NVIDIA EGX Edge AI platforms, or custom Raspberry Pi clusters for municipal deployments.
Edge computing reduces round-trip latency from milliseconds to microseconds for geographically dispersed data sources.
- High-Performance Servers and GPUs
Centralized data hubs (e.g., Apache Kafka brokers, Flink task managers) demand servers with NVMe storage and multi-core CPUs. GPUs accelerate analytics (e.g., real-time video processing for public safety).
- Network Backbones
Fiber-optic infrastructure and 5G/6G networks enable sub-10ms latency for urban deployments. Satellite links (e.g., Starlink) extend coverage to rural areas but introduce higher latency (~50–100ms).
Software Stack for Real-Time Data Streaming
The software ecosystem governs data ingestion, processing, and dissemination. Open-source and proprietary tools serve distinct roles, each with trade-offs in cost, flexibility, and compliance.Open-Source Tools: Cost-Effective and Customizable
- Pros:
- Scalable to millions of messages/second with horizontal partitioning.
- Strong ecosystem (Kafka Streams, ksqlDB) for real-time SQL queries.
- Open governance model reduces vendor lock-in.
- Cons:
- Requires expertise for tuning (e.g., partition sizing, replication factor).
- Limited built-in compliance features (e.g., GDPR data retention policies).
- Pros:
- Exactly-once processing semantics for critical public data (e.g., emergency alerts).
- Native support for event-time processing (critical for out-of-order streams).
- Cons:
- Steeper learning curve than simpler tools like Spark Streaming.
- Resource-intensive for large-scale deployments.
Redis Streams (with consumer groups) enable fan-out to multiple subscribers without reprocessing, reducing latency in multi-agency systems.Proprietary Tools: Optimized for Compliance and Support
- Pros:
- Built-in compliance certifications (e.g., HIPAA, ISO 27001) for public sector use.
- Auto-scaling and serverless tiers reduce operational burden.
- Cons:
- Vendor lock-in; data egress fees can escalate costs.
- Limited customization for niche public data formats (e.g., geospatial vectors).
- Pros:
- End-to-end SLAs for latency-sensitive applications (e.g., stock market feeds).
- Integrated governance for audit trails.
- Cons:
- High licensing costs (e.g., TIBCO’s annual fees exceed $100K for large deployments).
- Proprietary formats may complicate interoperability.
Public data systems must align with:
Blockchain and Distributed Ledgers for Transparency
Blockchain technologies introduce immutable audit trails and decentralized verification, addressing trust deficits in real-time public data. Key applications include:Use Cases for Auditability
Hyperledger Fabric’s permissioned ledgers reduce costs for public agencies by limiting participation to authorized validators (e.g., city council, independent auditors).
- Automated Compliance
Oracles (e.g., Chainlink) fetch off-chain data (e.g., air quality indices) and publish verified hashes on-chain. This enables automated compliance checks (e.g., triggering alerts if PM2.5 levels exceed EPA thresholds).
Technical Implementation
| Component | Example Technology | Latency Impact |
|---|---|---|
| Consensus Mechanism | Proof-of-Authority (PoA) | <1s (suitable for public sector) |
| Smart Contracts | Solidity (Ethereum) / Chaincode (HLF) | ~100–500ms for execution |
| Data Storage | IPFS + Ethereum | ~2–5s for large datasets |
| Query Layer | The Graph (for indexed public data) | <500ms for filtered queries |
Data Path Flowchart: Source to End-User with Latency Benchmarks
The following annotated flowchart illustrates the critical path for real-time public data dissemination, with latency benchmarks at each stage. Note: Values assume optimized infrastructure; actual performance varies by deployment.[Data Source] → [Edge Preprocessing] → [Ingestion Layer] → [Stream Processing] → [API Gateway] → [End-User App]
Stage Breakdown
1. Data Source (e.g., Traffic Camera)
2. Edge Preprocessing (e.g., NVIDIA Jetson)
3. Ingestion Layer (e.g., Kafka Cluster
Use Cases and Applications in Public Sector Operations
Real-time public data systems transform how governments and public agencies respond to crises, optimize service delivery, and engage citizens. By leveraging live data feeds—such as sensor networks, geospatial analytics, and crowdsourced inputs—public sector operations achieve greater efficiency, transparency, and resilience. These applications range from life-saving disaster coordination to data-driven urban planning, where timely insights reduce response times, mitigate risks, and enhance citizen trust through actionable information.The integration of real-time data into public operations addresses critical gaps in traditional reactive governance models. For instance, during emergencies, delays in data dissemination can exacerbate vulnerabilities, while in routine services, proactive adjustments based on live metrics improve resource allocation and reduce inefficiencies. Below, key applications are examined across disaster response, urban mobility, fraud prevention, and civic innovation, with a focus on measurable impacts and implementation frameworks.
Disaster Response Coordination with Real-Time Public Data
Real-time public data systems play a pivotal role in disaster response by enabling dynamic decision-making, resource allocation, and public safety communication. Live flood mapping, evacuation routing, and automated resource deployment rely on integrated data layers such as precipitation sensors, river gauges, satellite imagery, and social media feeds. These systems reduce false alarms, optimize shelter assignments, and minimize collateral damage by providing actionable insights to emergency responders.Key Components of Real-Time Disaster Response Systems:
Real-time disaster coordination involves the following interconnected elements, each contributing to a cohesive response framework:
-
Live Flood Mapping and Hydrological Modeling
Integration of real-time river flow data, weather radar, and IoT-enabled water level sensors (e.g., USGS stream gauges or EU’s Copernicus Emergency Management Service) generates dynamic flood inundation maps. Machine learning models predict flood progression up to 72 hours in advance, allowing authorities to pre-position sandbags, activate barriers, and issue targeted evacuation orders. -
Evacuation Routing and Traffic Management
Real-time traffic data from connected vehicles (e.g., Waze, Google Maps), public transit APIs, and road sensors inform dynamic rerouting algorithms. Systems like Japan’s Disaster Prevention Information Portal or the UK’s Flood Warning Information Service adjust evacuation routes based on congestion, road closures, and flood risk zones, reducing travel time by up to 40% during emergencies. -
Automated Resource Allocation
AI-driven logistics platforms (e.g., Palantir Gotham or ESRI’s ArcGIS Emergency) match supply (e.g., medical teams, food supplies) with demand in real time. Drones equipped with thermal cameras and LiDAR assess structural damage, while blockchain-based supply chains (e.g., IBM’s Trust Your Supplier) verify the authenticity of donated goods to prevent misallocation.
During Hurricane Harvey, the Harris County Flood Warning System combined real-time rain gauge data, NOAA radar feeds, and crowdsourced reports to issue hyper-local flood alerts via SMS and social media. The system’s predictive models reduced false alarms by 60% and enabled the city to evacuate 120,000 residents from high-risk zones within 12 hours. Post-event analysis revealed that areas with active flood mapping had 25% lower property damage compared to regions relying on static risk maps.Implementation Challenges and Solutions:
-
Data Silos
Challenge: Fragmented data sources (e.g., local weather stations vs. national agencies) delay integration.
Solution: Adopt FAIR data principles (Findable, Accessible, Interoperable, Reusable) and standardized APIs (e.g., OGC SensorThings API) to unify feeds. -
Public Trust and Misinformation
Challenge: Over-reliance on automated alerts may lead to alert fatigue or distrust.
Solution: Implement human-in-the-loop validation (e.g., FEMA’s Community Lifelines) and multi-channel verification (e.g., cross-referencing with local emergency broadcasts). -
Scalability for Low-Resource Regions
Challenge: High infrastructure costs limit adoption in developing nations.
Solution: Deploy low-cost IoT sensors (e.g., Raspberry Pi-based flood monitors) and leverage mobile data (e.g., Ushahidi’s crowdsourced reporting).
Designing a Real-Time Public Dashboard for Urban Mobility
Urban mobility dashboards aggregate real-time data from transit agencies, traffic sensors, and citizen feedback to optimize commuter experiences and reduce congestion. Effective design requires layered data visualization, intuitive user interaction, and seamless integration with existing infrastructure. Below is a step-by-step procedure for developing such a dashboard, focusing on data sources, technical architecture, and user-centric features.Step 1: Define Data Layers and Sources
A comprehensive urban mobility dashboard relies on the following data categories, each requiring distinct collection methods:
-
Transit Performance Metrics
Data sources include:- General Transit Feed Specification (GTFS)-real-time feeds (e.g., Google Transit, OneBusAway).
- Automatic Vehicle Location (AVL) systems from buses/trams.
- Passenger count sensors (e.g., IR-based footfall analytics).
-
Road and Traffic Conditions
Data sources include:- Inductive loop sensors and Bluetooth/Wi-Fi probe data (e.g., INRIX, TomTom Traffic Index).
- Connected vehicle data (e.g., GM’s OnStar, Tesla’s Fleet API).
- Crowdsourced reports (e.g., Waze, Citymapper).
-
Alternative Mobility Data
Data sources include:- Bike-sharing systems (e.g., Santander Cycles API, Lime’s real-time availability).
- Ride-hailing demand (e.g., Uber Movement, Didi Chuxing’s mobility reports).
- Pedestrian flow data from smart crosswalks (e.g., Siemens’ traffic light sensors).
-
Environmental and Safety Indicators
Data sources include:- Air quality sensors (e.g., PurpleAir, London’s Ultra Low Emission Zone (ULEZ) monitors).
- Noise pollution levels (e.g., Decibel.io).
- Emergency call data (e.g., 911 dispatch logs).
The backend must support low-latency processing and scalability. Key components include:
-
Data Ingestion Layer
Use Apache Kafka or AWS Kinesis to stream data from heterogeneous sources into a centralized pipeline. Implement data validation rules (e.g., rejecting outliers in traffic speed data). -
Processing and Analytics
Deploy real-time analytics engines like Apache Flink or Spark Streaming to compute metrics such as:- Predictive congestion models using graph neural networks (e.g., DeepMind’s traffic prediction).
-
Challenges and Ethical Considerations in Real-Time Public Data Systems
Real-time public data systems enhance operational efficiency, transparency, and citizen engagement but introduce complex technical, ethical, and governance challenges. Ensuring data accuracy, consistency, and privacy in high-velocity streams—while mitigating risks like algorithmic bias and digital exclusion—requires robust frameworks and proactive policy interventions. This section examines the technical hurdles in maintaining data integrity under edge-case conditions, explores ethical dilemmas in public data dissemination, and proposes a governance model to balance transparency with security. Regulatory compliance further complicates implementation, necessitating alignment with global standards such as GDPR and open data laws.
Technical Challenges in Data Accuracy, Consistency, and Privacy
Data Accuracy and Consistency in High-Velocity Streams
Real-time public data systems rely on continuous, high-frequency updates from diverse sources—IoT sensors, APIs, citizen reports, and government databases—which introduces vulnerabilities to inaccuracies. Sensor failures, network latency, or conflicting data streams (e.g., traffic cameras vs. GPS telemetry) can propagate errors exponentially. For instance, a single malfunctioning air quality sensor in a smart city network may distort pollution alerts, leading to misinformed public health responses. Edge-case scenarios—such as concurrent system failures during peak demand (e.g., election results or disaster response)—exacerbate inconsistencies, requiring redundant validation layers.To address these challenges:
- Multi-source triangulation: Cross-verifying data from independent sources (e.g., combining weather radar with ground station reports) reduces single-point failures.
- Anomaly detection algorithms: Machine learning models trained on historical patterns can flag outliers (e.g., sudden spikes in energy consumption) for human review.
- Deterministic validation rules: Predefined thresholds (e.g., "no more than 5% deviation in sensor readings within a 10-minute window") trigger alerts or automated corrections.
- Edge computing: Processing data closer to sources (e.g., traffic cameras) minimizes latency-induced inconsistencies before transmission to central systems.
Privacy Preservation in Real-Time Data
Public data streams often include personally identifiable information (PII) or sensitive attributes (e.g., geolocation, health metrics) even when anonymized. Differential privacy techniques—adding statistical noise to datasets—can obscure individual records while preserving aggregate utility, but they introduce trade-offs in granularity. For example, a city’s real-time mobility dataset might obscure exact bus arrival times to prevent re-identification, hindering transit optimization. Dynamic privacy controls are essential, where access permissions adjust based on context (e.g., restricting geotagged emergency data during crises).Key strategies include:
- Federated learning: Training models on decentralized data (e.g., hospital patient flows) without centralizing raw records.
- Tokenization: Replacing PII with non-sensitive tokens (e.g., replacing "John Doe" with "Token-4711") while maintaining linkage for authorized users.
- Temporal anonymization: Delaying or aggregating data (e.g., releasing crime statistics hourly rather than per incident) to reduce re-identification risks.
Ethical Implications and Mitigation Strategies
Algorithmic Bias and Fairness in Real-Time Decision-Making
Public sector algorithms—used in policing, welfare distribution, or infrastructure planning—often inherit biases from training data or design flaws. For example, predictive policing models trained on historical arrest data may disproportionately target marginalized communities, reinforcing systemic inequalities. Real-time bias amplification occurs when dynamic data (e.g., live traffic patterns) interacts with biased models, creating feedback loops. A 2020 study by the Algorithm Justice League found that facial recognition systems in real-time surveillance had error rates of up to 35% for darker-skinned women, leading to false arrests.Mitigation requires:
- Bias audits: Regular testing of algorithms against demographic parity metrics (e.g., ensuring error rates do not exceed 5% across subgroups).
- Explainable AI (XAI): Implementing models with interpretable outputs (e.g., decision trees instead of black-box neural networks) to justify real-time actions to stakeholders.
- Diverse training datasets: Actively curating data to include underrepresented groups (e.g., incorporating non-traditional mobility data like bike-sharing usage in transit planning).
- Human-in-the-loop validation: Requiring manual review for high-stakes decisions (e.g., real-time eviction notices) where algorithmic outputs may disproportionately affect vulnerable populations.
Digital Divide and Access Inequities
Real-time public data systems often assume universal connectivity and digital literacy, exacerbating disparities. Low-income households or rural communities may lack high-speed internet, preventing access to time-sensitive alerts (e.g., flood warnings or vaccine availability). The 2021 Digital Economy Report by the UN noted that 57% of the global population remains offline, with gaps widening in real-time service adoption.Actionable strategies for policymakers:
- Tiered data delivery: Offering multiple access channels (e.g., SMS alerts for offline users, low-bandwidth APIs for feature phones).
- Public digital literacy programs: Partnering with libraries and community centers to teach real-time data interpretation (e.g., reading air quality indices).
- Subsidized infrastructure: Prioritizing fiber-optic expansion in underserved areas to enable real-time services like telemedicine or remote education.
- Progressive disclosure: Releasing data in digestible formats (e.g., plain-language summaries alongside raw datasets) to reduce cognitive barriers.
Governance Framework for Transparency and Security
Balancing public access with critical infrastructure protection demands a role-based access control (RBAC) model tailored to data sensitivity levels. The framework should integrate dynamic authorization—where permissions adjust based on context (e.g., a journalist accessing traffic data during rush hour but not during a cyberattack drill)—and attribute-based access control (ABAC), which evaluates user roles, data attributes, and environmental factors.Core Components of the Framework
"Transparency without security is vulnerability; security without transparency is oppression." — Adapted from OECD Principles on Digital Governance (2021)
Conflict Resolution MechanismsComponent Implementation Strategy Example Use Case Data Classification Categorize data by sensitivity (e.g., Public, Internal, Restricted, Critical). Critical: Real-time power grid telemetry; Public: Open transit schedules. Role-Based Access Assign permissions (Read, Write, Modify) to roles (Citizen, Journalist, Emergency Worker). Emergency workers gain real-time access to hospital bed availability during crises. Temporal Controls Enforce time-bound access (e.g., data available only during business hours). Restrict live election result APIs to polling stations until official certification. Audit Logs Log all access attempts, modifications, and data exports for compliance and anomaly detection. Track which agency accessed disaster response data during a hurricane. Automated Redaction Use NLP to redact PII or sensitive terms (e.g., "confidential" in procurement data) before public release. Publish tender documents with redactions for proprietary technology details.
Disputes over data access (e.g., a journalist requesting restricted climate data) should follow a multi-tiered escalation process:
1. Self-service portal: Users request access via a standardized form with justification.
2. Automated review: AI flags requests for sensitive data (e.g., law enforcement feeds) for manual review.
3. Ethics committee: A cross-agency panel (including civil society representatives) adjudicates appeals within 48 hours.
4. Judicial override: Legal challenges bypass the committee for urgent cases (e.g., FOIA requests).
Regulatory Frameworks and Compliance Requirements
Global and regional regulations impose varying obligations on real-time public data sharing, often conflicting in scope. Below is a summary of key frameworks and their compliance requirements, categorized by focus area.Data Protection and Privacy Laws
Real-time data collection and processing must comply with privacy-centric regulations, particularly where PII is involved.- General Data Protection Regulation (GDPR) – EU/EEA
- Right to erasure: Individuals can request deletion of their real-time data (e.g., geolocation traces) within 30 days.
- Data minimization: Only collect data necessary for the stated purpose (e.g., anonymizing IP addresses in live web traffic analytics).
- Automated decision-making: Prohibits real-time profiling without human oversight (e.g., automated loan approvals).
- Data breach notification: Real-time systems must report breaches within 72 hours, including incidents affecting live datasets (e.g., exposed surveillance footage).
- California Consumer Privacy Act (CCPA) – USA
- Opt-out rights: Citizens can opt out of the sale or sharing of their real-time data (e.g., location data sold to advertisers).
- Sensitive data protections: Extra safeguards for biometrics, geolocation, and health data in real-time streams.
- Non-discrimination
Implementation Roadmap for Agencies Adopting Real-Time Public Data
Deploying real-time public data systems requires a structured, phased approach to ensure alignment with operational goals, stakeholder expectations, and scalability. Agencies must balance rapid deployment with long-term sustainability, integrating pilot projects, stakeholder collaboration, and iterative improvements. This roadmap provides a framework for city governments to transition from legacy systems to real-time data ecosystems while mitigating risks and optimizing resource allocation.The implementation process involves defining clear milestones, establishing governance models, and leveraging modular architectures to accommodate evolving needs. Key components include selecting high-impact pilot projects, negotiating data-sharing agreements with private and public partners, and prioritizing initiatives based on citizen-centric metrics. Below, structured phases, templates, and evaluation tools are outlined to guide agencies through adoption.
Phased Approach to Real-Time Public Data Deployment
A phased implementation ensures incremental progress, allowing agencies to refine processes, address challenges early, and demonstrate value to stakeholders. The roadmap consists of five phases, each with distinct objectives, deliverables, and success criteria.Phase 1: Strategic Planning and Stakeholder Alignment
Agencies must first establish a cross-departmental task force to define the scope, objectives, and governance of the real-time data initiative. This phase includes:
- Conducting a gap analysis to identify existing data silos, integration points, and technological limitations.
- Developing a data governance framework outlining roles, responsibilities, and compliance requirements (e.g., GDPR, open-data laws).
- Engaging citizens, private sector partners, and inter-agency teams through workshops and feedback sessions to align expectations.
- Key Deliverable: A signed Real-Time Data Strategy Document approved by city leadership, including a high-level timeline and budget allocation.
Phase 2: Pilot Project Selection and Design
Pilot projects serve as proof-of-concept for real-time data applications, focusing on high-impact, low-complexity use cases. Criteria for selection include:
- Citizen benefit: Projects addressing urgent public needs (e.g., traffic congestion, emergency response, air quality alerts).
- Data availability: Leveraging existing datasets with minimal additional collection costs.
- Technical feasibility: Compatibility with current infrastructure (e.g., APIs, cloud storage, or edge computing).
- Example Pilots:
- Smart Traffic Management: Real-time traffic signal optimization using IoT sensors and machine learning (e.g., Pittsburgh’s SCATS system).
- Public Safety Alerts: Integration of 911 call data with emergency vehicle tracking for faster response times (e.g., Denver’s Real-Time Crime Center).
- Air Quality Monitoring: Deployment of low-cost sensors in high-pollution zones with API-based dissemination (e.g., London’s Breathe London project).
Phase 3: Technology and Partnership Integration
This phase involves selecting vendors, negotiating data-sharing agreements, and integrating systems. Critical actions include:
- Vendor evaluation (detailed checklist provided in a subsequent section) to ensure interoperability with legacy systems.
- Data-sharing agreements with private partners (templates included below) to clarify liability, ownership, and usage restrictions.
- API development for seamless data exchange between agencies and public-facing platforms (e.g., city portals, third-party apps).
- Key Deliverable: A minimum viable product (MVP) for the pilot, including a dashboard or API endpoint for real-time data access.
Phase 4: Scalability and Integration
Successful pilots are expanded to other departments or city services, with a focus on:
- Modular architecture: Designing systems to support additional data sources (e.g., adding weather data to traffic models).
- Inter-agency collaboration: Standardizing data formats (e.g., JSON, XML) and metadata schemas for consistency.
- Performance monitoring: Establishing KPIs (e.g., data latency, API uptime, citizen engagement metrics).
- Example Scalability Milestones:
- Year 1: Deploy real-time data for 3–5 high-priority services (e.g., transit, public safety).
- Year 2: Integrate data from 10+ departments, including utility management and environmental monitoring.
- Year 3: Achieve citywide interoperability with private-sector platforms (e.g., ride-sharing apps, smart meters).
Phase 5: Continuous Improvement and Policy Refinement
Ongoing evaluation ensures the system evolves with technological and regulatory changes. Activities include:
- Citizen feedback loops: Surveys and public forums to assess usability and perceived value.
- Regulatory compliance audits: Annual reviews to align with evolving data privacy laws (e.g., CCPA, EU AI Act).
- Cost-benefit analysis: Reassessing ROI based on operational efficiencies and citizen outcomes.
- Key Deliverable: A Real-Time Data Governance Playbook documenting lessons learned, best practices, and update protocols.
Templates for Data-Sharing Agreements
Data-sharing agreements between public agencies and private partners must address legal, technical, and ethical considerations to prevent disputes and ensure compliance. Below are three critical templates covering liability, data ownership, and usage restrictions.Template 1: Liability and Indemnification Clause
Article 4: Liability and Indemnification
Template 2: Data Ownership and Usage Rights
4.1 Data Provider Liability: The [Public Agency] ("Provider") warrants that the data shared under this Agreement is accurate to the best of its knowledge and free from malicious content. The Provider shall not be liable for any errors, omissions, or delays in the data, except in cases of gross negligence or willful misconduct.4.2 Partner Liability: The [Private Partner] ("Recipient") shall indemnify and hold harmless the Provider from any claims, damages, or legal actions arising from the Recipient’s misuse, unauthorized redistribution, or modification of the shared data.
4.3 Third-Party Claims: Both parties agree to cooperate in defending against any third-party claims related to data accuracy or usage, provided the claimant’s allegations are substantiated.
Article 5: Data Ownership and Usage
Template 3: Compliance and Audit Provisions
5.1 Ownership: All data provided by the Provider retains ownership by the [City Government] or its authorized agencies. The Recipient may use the data solely for the purposes outlined in Appendix A of this Agreement.5.2 Permitted Uses:
- Development of [specific applications, e.g., "traffic optimization tools" or "public safety dashboards"].
- Internal analysis for operational improvements (non-commercial use only).
- Aggregation with other non-sensitive datasets for research (with Provider approval).
5.3 Prohibited Uses:
- Selling or licensing the data to third parties without written consent.
- Using the data for targeted advertising, political campaigning, or profiling individuals.
- Altering or obscuring metadata or source attributions.
5.4 Data Retention: The Recipient shall purge or anonymize the data within [X] months of Agreement termination, unless otherwise specified.
Article 6: Compliance and Audits
Implementation Notes:
6.1 Regulatory Adherence: The Recipient shall comply with all applicable laws, including but not limited to:
- [GDPR/CCPA/Other relevant regulations].
- [City-specific open-data policies, e.g., "Executive Order No. [XXX] on Public Data Access"].
6.2 Audit Rights: The Provider reserves the right to conduct annual or ad-hoc audits to verify compliance with this Agreement. The Recipient shall provide reasonable access to systems, logs, and documentation upon request.
6.3 Breach Notification: In the event of a data breach involving Provider-supplied data, the Recipient shall notify the Provider within [24 hours] and cooperate in remediation efforts.
- Customization: Agreements should be tailored to the specific dataset (e.g., sensitive vs. non-sensitive data) and jurisdiction.
- Legal Review: Engage legal counsel to ensure alignment with local, state, and federal laws.
- Example: The City of Boston’s Open Data Policy includes similar clauses for third-party data use, emphasizing transparency and accountability.
Prioritizing Real-Time Data Projects Using a Weighted Scoring System
Agencies must allocate resources efficiently by prioritizing projects based on citizen impact, feasibility, and strategic alignment. A weighted scoring system (table below) quantifies these factors to inform decision-making. Weights are assigned based on agency goals (e.g., public safety may prioritize response-time reduction over cost savings).
Criteria Weight (%) Scoring Guide (1–5) Example Calculation Citizen Impact 40% -
<
The future of real-time public data lies at the intersection of technological advancement and inclusive governance. As cities deploy edge computing to process traffic data in milliseconds or healthcare systems leverage live patient monitoring for triage decisions, the demand for seamless, scalable infrastructures will continue to grow. Yet, the success of these initiatives depends on proactive measures: adopting open-source tools to reduce vendor lock-in, implementing bias audits in algorithmic workflows, and establishing clear compliance frameworks to align with global regulations like GDPR. For agencies embarking on this journey, the key lies in iterative piloting—testing solutions with high-impact, low-risk projects before scaling—while fostering partnerships between public and private sectors to share costs and expertise. Ultimately, real-time public data is not merely a tool but a catalyst for smarter, more responsive governance, provided its deployment is guided by transparency, equity, and a commitment to public good.
Leave a Comment
Comments are moderated before appearing. The data you submit is processed according to the Privacy Policy of ir.msu.ac.zw.